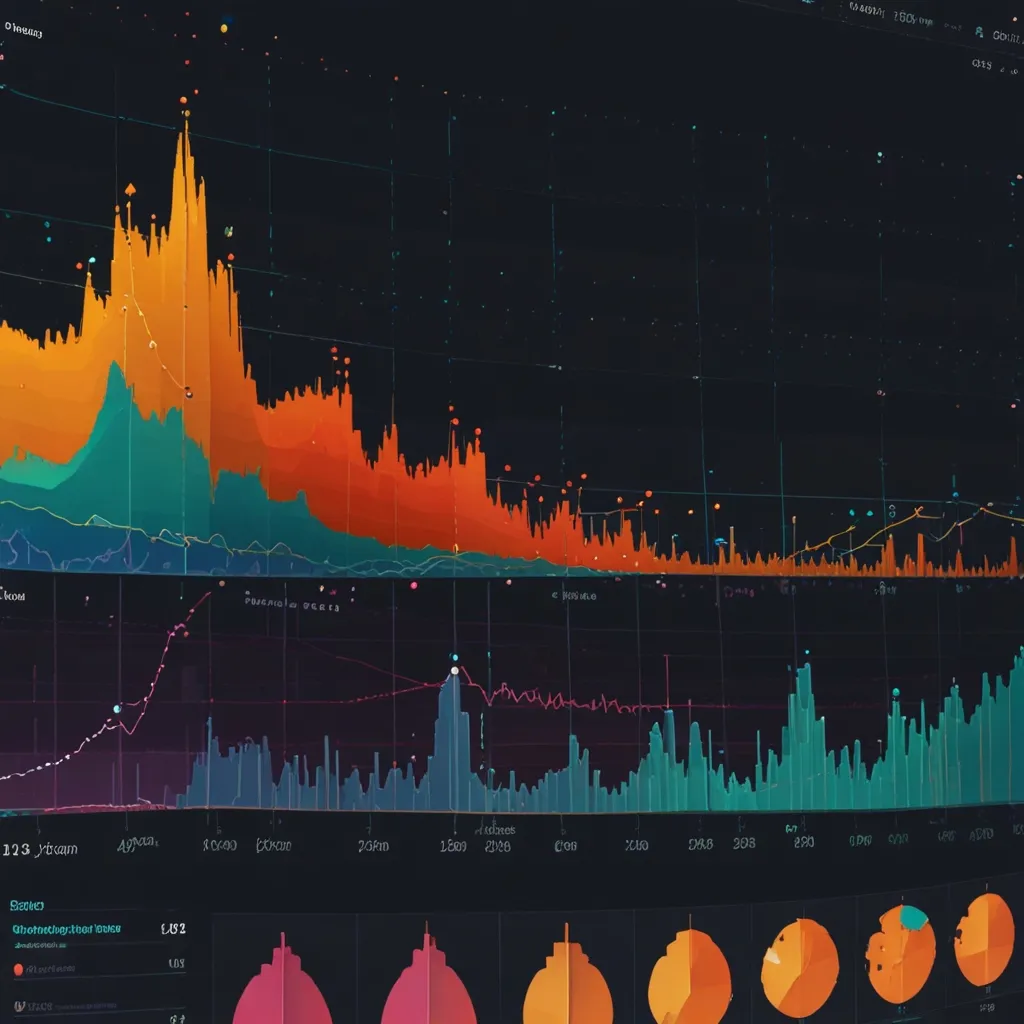
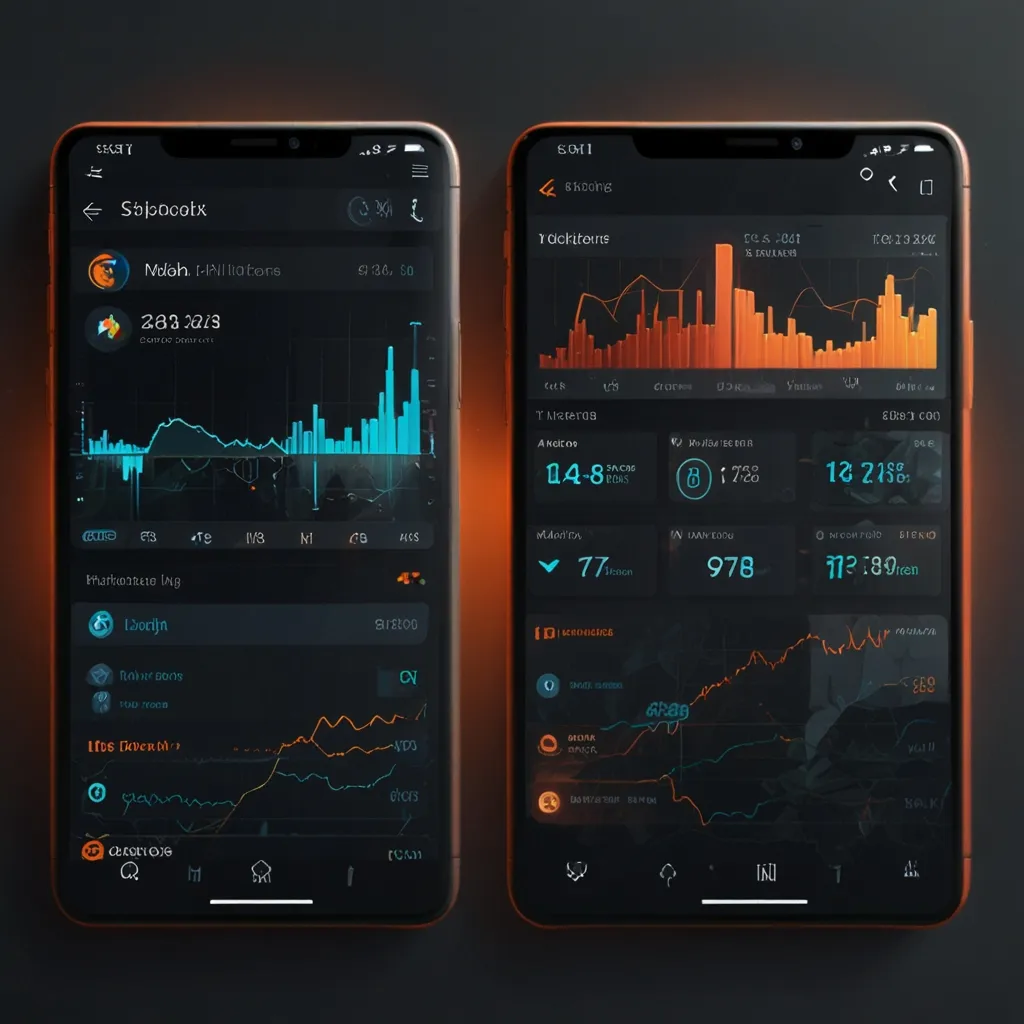
In the bustling world of data visualization, D3.js has become a game-changer. This JavaScript library, which stands for Data-Driven Documents, has completely revamped how we illustrate and interact with data on the web. Created by Mike Bostock in 2011, D3.js uses web standards like HTML, SVG, and CSS to create dynamic, engaging visualizations that make data pop.
One of the most impressive things about D3.js is its versatility. Unlike other visualization libraries, D3.js offers unparalleled flexibility and elegance, thanks to its ability to bind any data to the Document Object Model (DOM) and perform data-driven transformations. This means developers have complete control over the final look and feel of their visualizations, making it possible to create unique and eye-catching designs that aren’t achievable with other tools.
A primary strength of D3.js is its ability to handle any kind of data with ease. Whether you’re working with numerical data, text, or geographical information, D3.js can seamlessly transform your data into compelling visual stories. This adaptability makes it a favorite across diverse fields, from journalism and academia to business and education. Imagine creating an interactive map that shows climate change effects, or dynamic charts that make financial data comprehensible—D3.js can handle it all.
Interactivity and fluidity are core aspects that set D3.js apart. It’s not just about creating static graphs; with D3.js, you can make your visualizations come alive. Smooth transitions and interactive elements—like clickable points or hover states—enhance user engagement and make complex data sets intuitive to explore. Picture a scatter plot where you can zoom into data clusters or a bar chart that reshapes itself as you adjust filters—D3.js brings this interactivity to life with ease.
Being part of the D3.js community is also a big plus. It’s a vibrant and active group with tons of resources available. Websites like bl.ocks.org and blockbuilder.org are treasure troves of pre-written code snippets that can help get your project off the ground quickly. You don’t have to struggle alone; the community-driven approach ensures that support is always just around the corner whenever you run into a challenge.
Starting with D3.js can be tough because there’s a bit of a learning curve, but the rewards are worth it. A basic understanding of JavaScript is a must since D3.js builds upon it. Getting started is as simple as downloading D3.js from the official site or using a CDN link in your HTML. Once you’ve got it included in your project, you can start selecting DOM elements and binding data to them. For beginners, making an SVG element and populating it with data via D3.js can be a fantastic first step.
D3.js relies heavily on SVG (Scalable Vector Graphics) for creating detailed and interactive graphics. This allows for precise control over the visuals, making it a go-to for intricate graphic work. The DOM manipulation capabilities of D3.js let you add, remove, or update elements effortlessly. With D3.js, managing and updating elements in your visualizations isn’t just easy; it becomes second nature.
Data binding is a fundamental concept in D3.js, involving associating your data with DOM elements to dynamically update the visualization as data changes. D3.js uses “joins” to maintain this data-DOM relationship, keeping your visuals synchronized with the underlying data. This makes maintenance and updates far less daunting.
Scales and axes are crucial in making a visualization meaningful. D3.js excels here by offering robust support for both. Whether it’s linear, logarithmic, or custom scales, D3.js has you covered. The ability to add axes effortlessly provides context and helps users interpret the data accurately. For instance, you could craft a line chart with a time scale on the x-axis and a linear scale on the y-axis to illustrate trends over time effectively.
Loading external data is hassle-free with D3.js, which supports fetching and parsing data from various sources like CSV files or JSON datasets with functions like d3.csv and d3.json. This ensures seamless integration of diverse data sources into your visualizations, making your job easier and your visuals more impactful.
Real-world applications of D3.js are everywhere. From interactive stories in the New York Times to scientific visualizations of climate data, D3.js makes complex data accessible and understandable. Visualization projects that once seemed daunting and time-consuming are now well within reach.
Interactivity is a key feature that makes D3.js stand out. You can add event listeners to your visualizations, making them more engaging. Clicks, mouseovers, and zooming can trigger animations or other changes, making the data interactive. Imagine a bar chart where the bars smoothly resize as the underlying data updates—it’s not only visually appealing but also highly functional, thanks to D3.js.
Handling large datasets can be tricky, but D3.js handles it like a pro. With powerful data manipulation capabilities such as filtering, sorting, and aggregating, D3.js proves invaluable for big data analytics. Creating interactive maps to display population density or other complex datasets becomes not just possible but straightforward.
D3.js is more than just a tool—it’s a powerhouse for creating dynamic, interactive data visualizations. Its flexibility, ease of handling diverse data types, and robust community support make it a top choice for developers and data analysts. Whether you’re working on a simple bar chart or a complex network visualization, D3.js equips you with the tools and resources you need to bring your data to life. Its blend of elegance, interactivity, and support makes it an indispensable asset for anyone serious about data visualization on the web.


